Tool features – Part 2
Debug Pane: This is very useful pane and used while the script is in debug mode. It has following sub pane.
1. Breakpoints : Display all the breakpoints applied in action scripts, function libraries and enable us to enable or disable any specific or all breakpoints.
2. Call stacks : Displays information about the functions, methods, or context currently relevant to your run session.
3. Loaded modules : It is used in API testing only. Provides information about .dll files associated with run session and their path to find and debug them.
4. Threads : It is used in API testing only. Provides information about threads in current run session.
5. Local Variables : Displays the current values and types of all variables.
6. Console : Enables us to run VBScript or C# commands when the current run session is paused.
7. Watch : Displays the current values and types of variables and VBScript or C# expressions that we add to the Watch pane. We can change the value of any variables displayed in the watch.
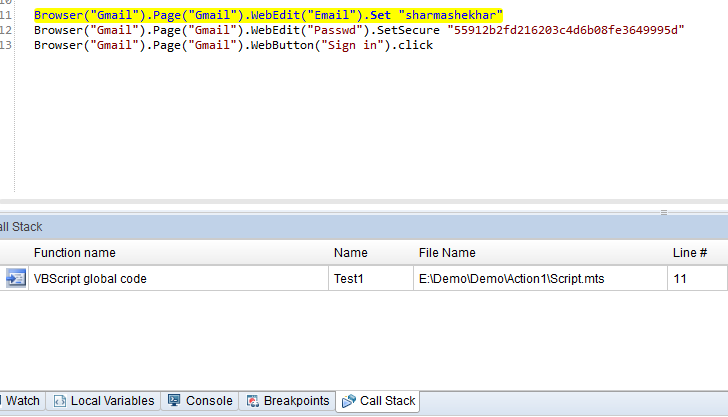
Debug Pane
Object Repository: Object repository is in -built feature of UFT. It is used to store the test objects (e.g. Text boxes, button,links etc.) of AUT (Application under test). These test objects have the properties which helps in object identification during run time. We will have a detailed session on Object repository.
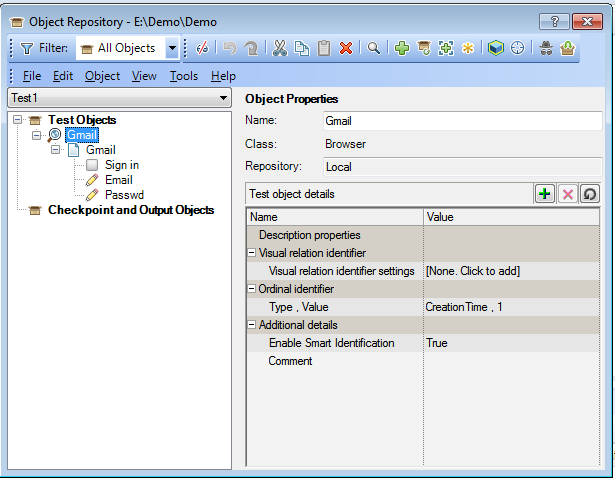
Object Repository
Object Spy : This is used to identify the object properties and can be used to store those objects into Object repository if required. We can click on ‘Hand shape’ button and hover on any object in the application and click on that object. Object spy will capture and show you all the properties of that object.
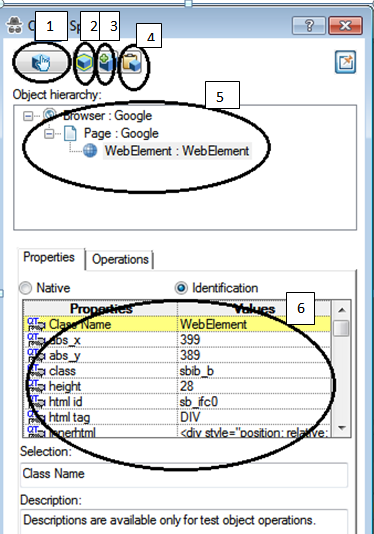
Object Spy
1. For spying the object. Click on it–> Hover on an object in AUT–> capture the properties.
2. It will highlight the captured object.
3. Add the object to object repository.
4. Copy all the properties identified by object spy. You can paste it on a notepad to see what it stores.
5. Object hierarchy of parent and child object captured.
6. Properties captured for the object.
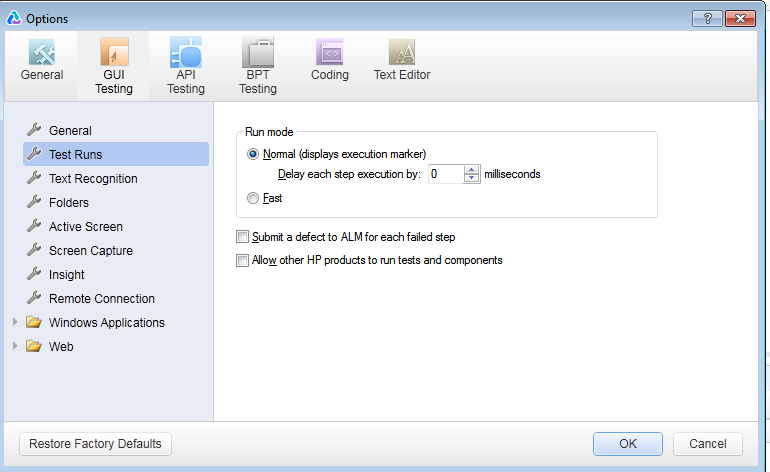
ALM connection: We can connect the ALM as well with UFT. For that,first step is to go to options Tools -> Options-> GUI testing -> Test Run (as shown in the screen shot below) and check the option ‘Allow other HP products to run tests and components’.
Second step is to go to ALM -> ALM connection. Here we need to provide ALM server details,username, password and project details. Click ok to connect to ALM.
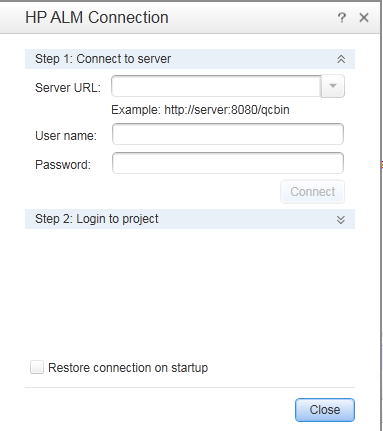
ALM connection
Run Menu: In Run menu, we have options to run.debug,Pause and stop the action script. We can enable and disable breakpoints. If we want to run the script from any step in the middle we have options available like ‘Debug from Step’ and ‘Run From Step’.
Other options available in Run menu are given below:
Step into(F11) : It will debug the script line by line and if there is a function call at any step, It will go into the function line by line till function ends and control returns to the line after called function.
Step Over(F10) : It will also debug the script line by line but the difference is if there is a function call at any step, it will execute the whole function without going inside the function and control returns to the next line after called function.
Step Out(Shift+F11) : Suppose we have stepped into any function but we dont want to go line by line to execute the function. In that case, we can use ‘Step Out’. It will execute the remaining code and controls returns to the line after called function.
Run Result viewer : After each execution, we can see the execution result in the run result viewer. It shows all the details like passed,failed,warning and done tests or components. It also shows total execution time,test name,time zone, run started time, run ended time,host name,operating system etc. It also shows result in graphical form and capture data and run time data table details.
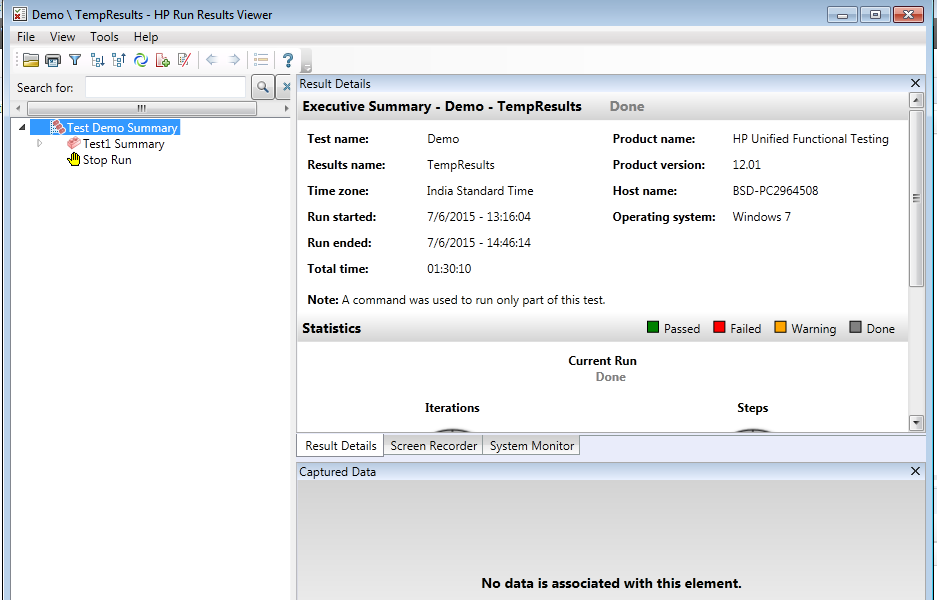
Run result viewer
We have covered most required feature from tool perspective. It will be helpful for a person, who is new to UFT, to understand the tool and start with.If you need any other details or want me to add something else, Please feel free to put in the comment box.

1 Response
[…] Remaining part will be completed in the Part 2. […]